Weather, Venues, and the Data Behind Enduring Projection Accuracy in Sports
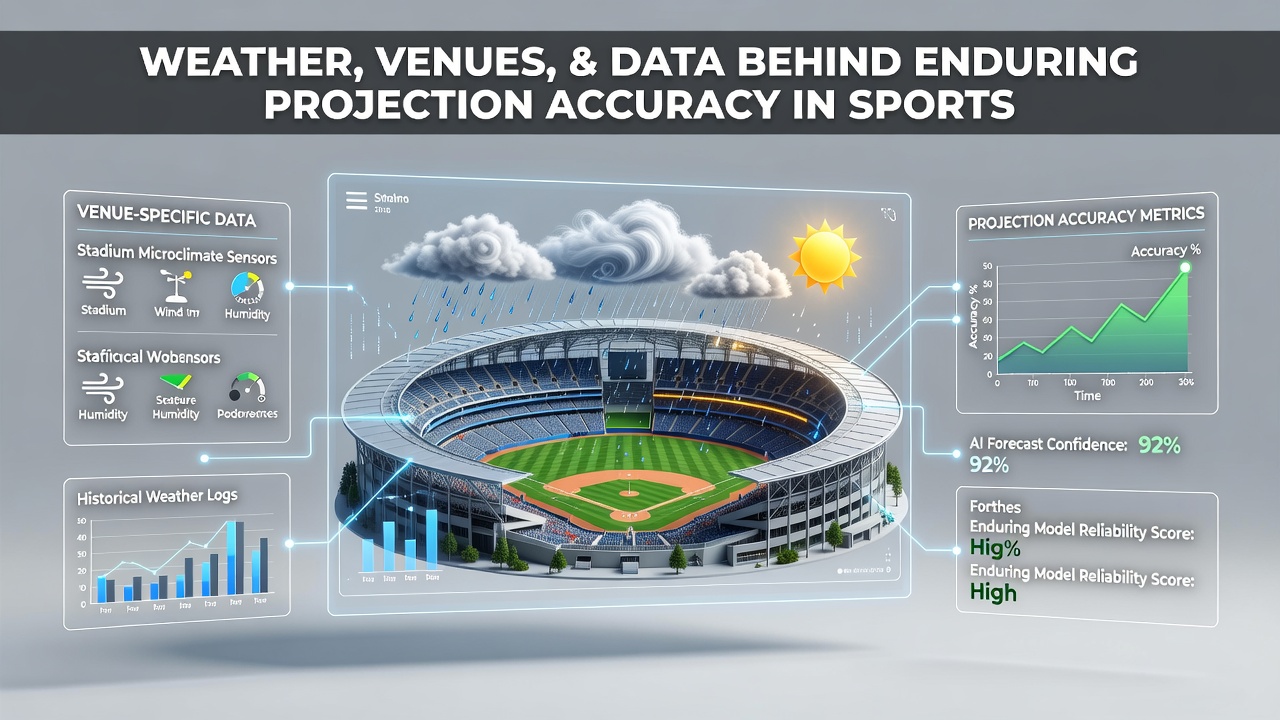
Weather patterns and venue characteristics shape performance metrics across outdoor sports, and analysts track these variables through layered datasets that feed projection models. In July 2026 observers note continued refinement of these systems as tournaments unfold during peak summer conditions in multiple regions.
Weather Variables in Performance Modeling
Precipitation, temperature swings, wind speed, and humidity levels alter ball trajectories, player endurance, and surface conditions in measurable ways. Researchers compile historical weather logs alongside game statistics to isolate these effects, and models then adjust expected outcomes accordingly. Studies from the National Oceanic and Atmospheric Administration have documented how wind gusts above 15 miles per hour reduce passing completion rates in American football by measurable margins, while similar datasets from the Australian Bureau of Meteorology track how heat stress during afternoon sessions affects serve speeds in tennis. Analysts incorporate real-time feeds from on-site sensors to update projections mid-event, which maintains accuracy when conditions shift rapidly.
Venue-Specific Factors and Historical Baselines
Stadium altitude, field dimensions, surface materials, and seating configurations create repeatable advantages or disadvantages for certain teams and athletes. Data teams maintain venue profiles that log average scoring rates, travel recovery times, and home-field effects across decades of matches. One dataset from a multi-year European football study showed that teams playing at elevations above 1,500 meters record lower high-intensity running distances in the first half compared with sea-level venues. Projection systems weight these venue constants heavily because they remain stable year after year, allowing long-term accuracy even when weather fluctuates.
Integration of Weather and Venue Data in Projection Systems
Modern models combine meteorological forecasts with venue databases through machine-learning frameworks that test thousands of variable combinations against past results. The process begins with baseline performance at each location, then layers expected weather deviations for the specific date and time. When July 2026 schedules placed several major tennis events in high-humidity regions, updated models recalibrated expected rally lengths and error rates using combined humidity and court-surface data. Teams responsible for these systems run back-tests that compare projected versus actual results over rolling five-year windows, and the resulting error margins have narrowed as sensor density and computational power increase.

Long-Term Accuracy Trends and Validation Methods
Projection accuracy is measured through metrics such as mean absolute error on score margins, win probability calibration, and cumulative return on simulated stakes. Independent audits compare model outputs against realized outcomes across thousands of events, and organizations publish annual reports that break down performance by sport, league, and weather category. A 2024 academic paper from a Canadian research consortium examined basketball projections and found that models incorporating both venue altitude and dew-point data maintained lower error rates during outdoor summer leagues than those using temperature alone. Continuous validation cycles allow developers to retire underperforming variables and retain those that demonstrate enduring predictive value across changing seasons and rule modifications.
Case Examples from Recent Seasons
During the 2025 horse racing calendar, analysts observed that models adjusted for track moisture content derived from rainfall totals produced more accurate speed figures at several North American venues. In parallel, cricket statisticians tracking subcontinent tours noted that humidity-adjusted spin-rate projections aligned closely with actual wicket tallies once venue-specific pitch preparation data was included. These examples illustrate how layered inputs reduce variance between forecast and result, and they contribute to the gradual improvement in multi-year accuracy scores reported by analytics groups.
Conclusion
Weather conditions and venue characteristics supply measurable inputs that projection systems integrate through structured datasets and repeated validation. Accuracy records maintained across multiple sports demonstrate that models accounting for both factors sustain lower error rates over extended periods compared with those relying on performance statistics alone. Continued collection of granular sensor data and venue logs supports ongoing refinement, and analysts expect these combined approaches to remain central to sports projection work through subsequent seasons.