Seasonal Cycles in Predictor Performance Across League Transitions and Event Calendars
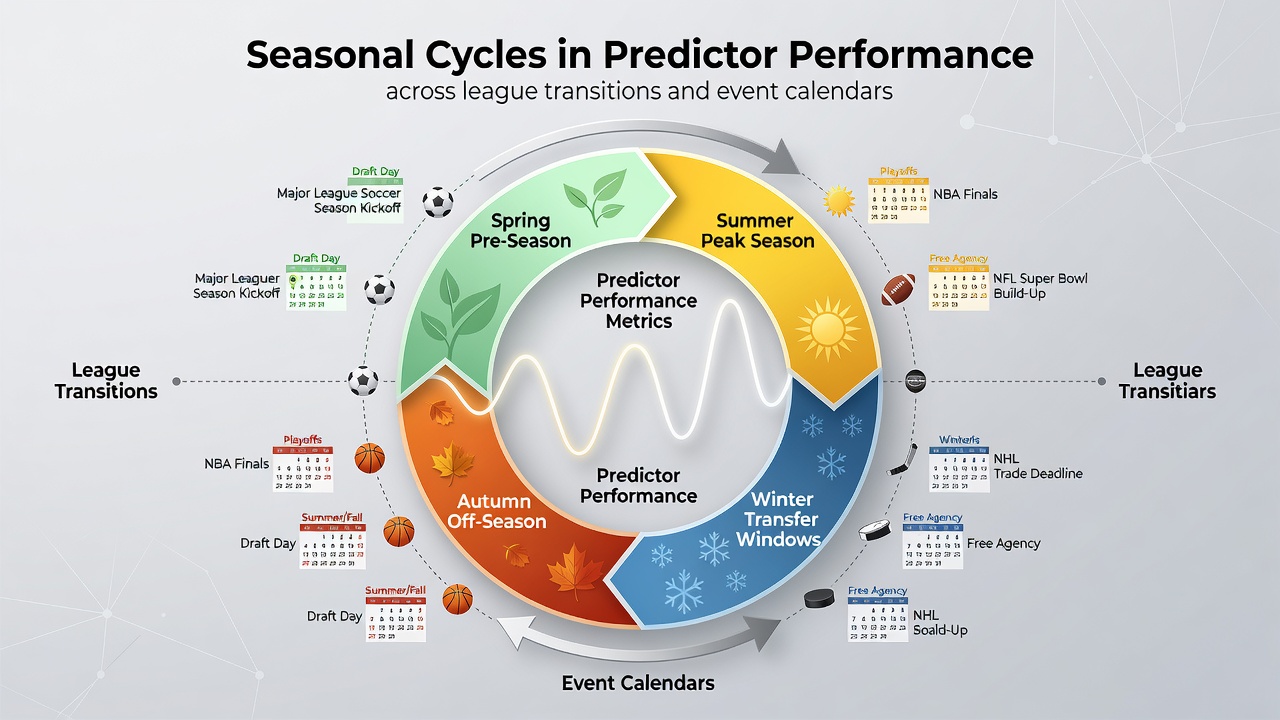
Seasonal cycles shape how prediction models and analytical systems perform when leagues shift between off-season breaks and active competition periods, while major event calendars introduce additional variables that alter accuracy rates over time. Data compiled from multiple sports analytics platforms shows consistent fluctuations tied to these transitions, with performance metrics rising and falling as team compositions change and schedules intensify.
League Transitions and Predictor Adjustments
Football leagues across Europe typically conclude their campaigns in May before entering a summer window that brings player transfers and pre-season preparations, and this period often coincides with reduced predictor reliability until new squad data stabilizes. Researchers tracking model outputs note that accuracy improves once August fixtures begin and historical patterns re-emerge, whereas basketball leagues such as the NBA experience similar resets when free agency and training camps alter roster dynamics each summer. Those who monitor these cycles observe that early-season games carry higher variance until sufficient matches accumulate, allowing algorithms to recalibrate weighting factors for current form and injury reports.
Horse racing calendars follow distinct seasonal patterns as well, with flat racing dominating summer months and jumps events peaking during winter, which forces prediction systems to switch datasets and adjust for track conditions that vary sharply between seasons. Tennis tournaments operate on a year-round circuit divided into hard-court, clay, and grass phases, where predictor performance dips during surface transitions because models require updated surface-specific statistics before regaining precision.
Event Calendars Influencing Performance Patterns
Major international events create concentrated periods of high-stakes matches that disrupt regular league-based prediction routines, and the approach of the 2026 FIFA World Cup scheduled for June and July 2026 provides one clear example where national team selections and travel schedules introduce variables not present in domestic competitions. Systems that incorporate player fatigue metrics and fixture congestion data tend to maintain steadier outputs during these windows, according to analyses shared by the American Gaming Association in their annual industry reports. Meanwhile, Olympic cycles and continental championships add further layers, prompting analysts to layer additional filters onto existing models.
What's notable is how predictor platforms handle overlapping calendars, such as when domestic leagues run alongside international qualifiers, because combined datasets require careful segmentation to avoid cross-contamination of signals. Studies from the University of Sydney's sports analytics group have documented these interactions across multiple seasons, revealing measurable shifts in hit rates when event density increases.
Regional Variations and Calendar Effects
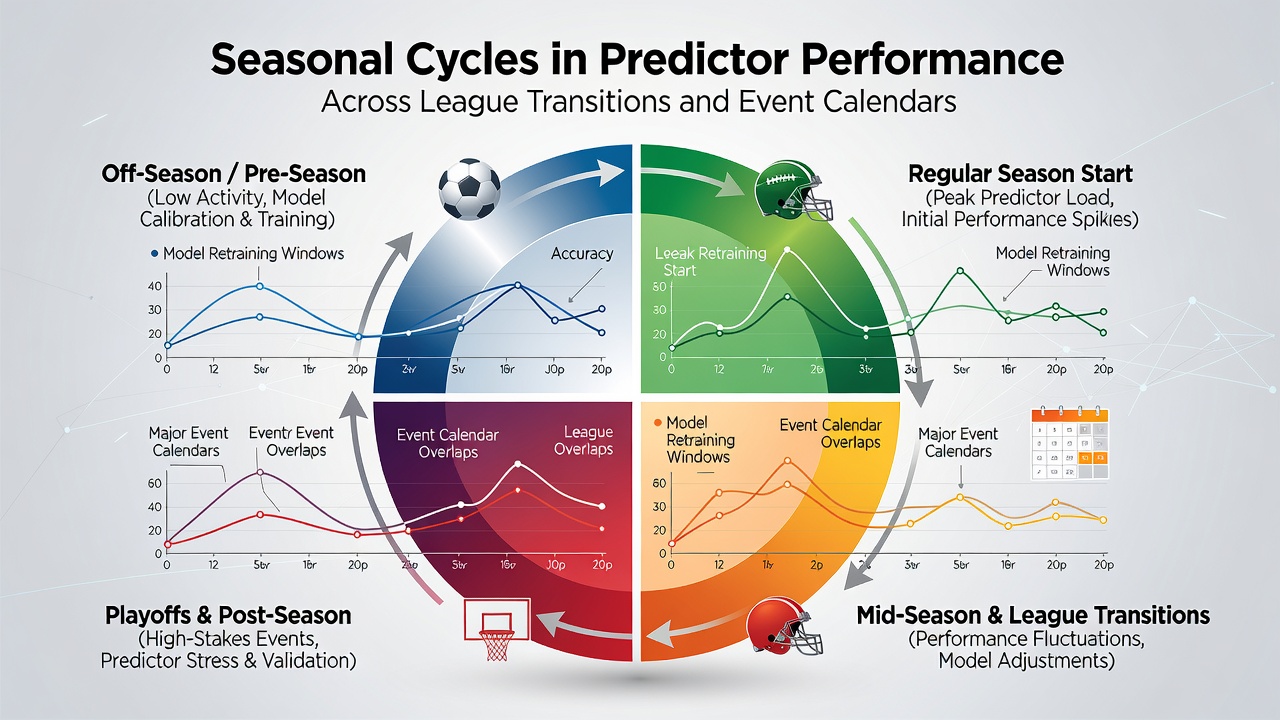
North American sports present their own seasonal rhythms, with NFL and NHL seasons overlapping in winter months while MLB occupies spring through autumn, and prediction systems must therefore prioritize different statistical priorities depending on the time of year. European observers note parallel patterns in rugby union and cricket, where domestic competitions pause for international tours that alter player availability and force model updates. Data indicates these transitions produce temporary accuracy drops until sufficient new matches provide fresh inputs for recalibration.
Event calendars also affect betting market liquidity, which indirectly influences how predictors incorporate odds movement as an additional signal, and platforms that integrate real-time market data show faster recovery during high-volume periods compared with those relying solely on team statistics. The Canadian Gaming Association has published summaries highlighting similar seasonal trends in regulated markets, underscoring the value of calendar-aware modeling approaches.
Analytical Methods for Tracking Cycles
Analysts apply rolling window evaluations and seasonal decomposition techniques to isolate performance trends from random variance, allowing clearer identification of periods when predictors consistently outperform or underperform baselines. These methods reveal recurring peaks around mid-season when data volume peaks and troughs during early and late campaign stages when roster instability rises. Organizations maintaining long-term tracking datasets emphasize the importance of separating league-specific effects from broader event-driven disruptions to refine model robustness.
Conclusion
Seasonal cycles tied to league transitions and event calendars create measurable patterns in predictor performance that repeat across sports and regions, with data from industry and academic sources confirming the value of calendar-aware adjustments. Continued monitoring through 2026 and beyond will likely refine understanding of how these rhythms interact with evolving competition structures.